| ||
| ||
| ||
| ||
| ||
| ||
| ||
| ||
| ||
| ||
| ||
| ||
|
Support  E-mail
© Copyright 2014 website2Go.com All Rights Reserved |
| Access Statistics |
You are here: Help Topics > Access Statistics
Access Statistics
What these charts, graphs & statistics tell you
- When you click on the Access Statistics button in Site Manager, you will immediately be taken to a page filled with an array of statistics, charts and graphs.
- Taken one or two at a time, these charts, graphs and statistics can give you insights into how you are using website2go and how others are using your site.
- Some of the data even gives you insight into who these other visitors to your site are.
- Web servers are designed to save statistics (called logs) about every single request and every single file which is served - what time, to which return IP address, to what kind of browser, and so on.
- The Access Statistics data are generated by the website2Go servers at a predetermined time near midnight. When you click on the Access Statistics button you call up the most recent set of statistics. Consequently any time during the same 24-hour period you access the statistics, you will be accessing the same statistics you had previously viewed.
- Each statistic is a different way of looking at the web server log.
- The descriptions below will take each chart, graph or statistic and explain what it is and how it may be useful to you.
Access Statistics for the last 12 months
The Graphical View
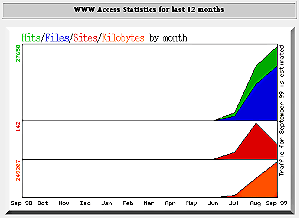
- This chart and the statistics shown below represent file and site accesses for one year starting with the current month and going back the previous 11 months.
- The GREEN data are the number of hits, which are the file transfer requests, your website received for the 12 months. A page with a text element and two images will get 3 hits from a single user going to that page.
- The BLUE data are the number of individual files which were sent to the user based on requests. The hits can be higher than the files because some files might already exist in the user's browser cache. This would be true, for instance, the second time the same user clicked on the URL for your home page. In that instance, you would get 3 additional hits but no files would be transferred.
- The RED data represents the number of unique sites (other IP address) which have visited your web site. The ratio of red to blue or red to green can give you an indication of how much individual visitors use your site. The larger the difference betwee red and green or red and blue the more apparent interest your site has to individual sites. Be aware, though, that some sites such as AOL appear to be identical to the server even though they may represent hundreds or thousands of individual users. In fact, most dial-up systems appear to be one site rather than a lot of users.
- The ORANGE data represents the amount of data which was transfered in kilobytes (thousands of bytes (8 bit words)). There should be a clear correlation between the orange chart and green or blue. It's possible, though, that a large number of users go to the same page on your site more than once. In cases like that, the GREEN graph will grow but the BLUE and ORANGE graphs will not.
- The absolute number of hits, files, sites and transfers are displayed vertically on the left hand side of this graph. The chart represents a relative display of the absolute data.
The Statistical View
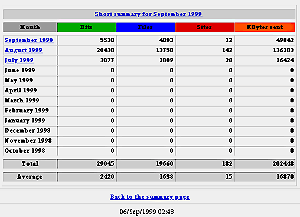
- These statistics, like the graph above it, are different representations of the same data. The graphs show relative numbers while this statistical chart shows absolute numbers.
- The GREEN data are the number of hits, or individual file transfer requests, your website received for the 12 months.
- The BLUE data are the number of individual files which were sent in response to requests.
- The RED data represents the number of unique sites (other IP address) which have visited your web site. The larger the difference between red and green or red and blue the more apparent interest your site has to individual visitors.
- The ORANGE data represents the amount of data which was transfered in kilobytes. Remember, though, that if a user has been to a page and goes back, the hits will grow but the files and kilobytes sent will not.
- The numbers at the bottom are aggregate numbers. Websites usually give data on number of unique visitors (sites) or number of hits on a monthly basis.
- Depending on how long you have had an account with website2Go, the statistics will show one or more months underlined.
- These months are hot-linked to a further analysis of that month's log files.
- Clicking on any month which is hot-linked will take you to another section of the Access Statistics section where you see graphs and charts which delve much more deeply into when, who and what the visitors to your site are doing.
- Those further statistics are explained below.
Delving deeper into the Log Files
- Clicking on a month which is underscored takes you to a range of log file statistics which can be overwhelming in its complexity.
- Remember that web servers keep statistics on every file and every user request.
- These log files have been broken into graphs and charts which – when understood– can tell you a great deal about the interests of your visitors and where they are coming from.
- Each of the separate statistical log analyses is explained below, along with how this information can be useful to you and your website and company or organization.
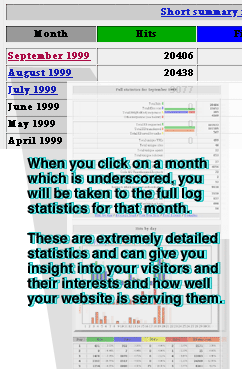
Full Statistics for Month *
Month * is whatever month you clicked on. You can only click on a month which is underscored indicating it is a link. You will be shown an initial set of charts for the whole year, whether or not you have a year's worth of statistics. Only those months where statistics actually exist will have links - indicated by the underscore (underline).
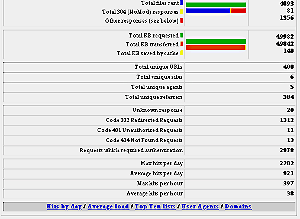
- The first several statistics, the ones in color, are repeats from the overview charts described above, this view, though, shows them as sections of a horizontal bar graph. The Green bars are the total hits and total file KBs transferred. The other colors represent fractions of the total above them.
- Total Hits are the aggregate numbers of requests made to any page, image, or file representing your web site.
- Total files sent is the number of individual responses either as HTML files (text) or image files (.jpg or .gif).
- Total 304 responses are the number of requests for files which resulted in no file being transferred because the file already existed in the user's browser cache. This would be true for someone who went to your home page and then went to a lower-level page and then went back to your home page. The second time he requested home page information the browser would ask the server for any changes to the file and if there weren't any the file would be retrieved from your hard drive rather than from the website2Go server. To some degree this represents user time saved.
- Other responses represent errors. The error codes can point to one or more problems with your site, including image files with the wrong extension.
- Total KB requested is the amount of information representing the total number of requests to your site. Total KB transferred is the amount of information actually sent to the browsers requesting it. The difference between the two represents a request for which the user already had the file in their browser's cache and therefore no file was sent.
- Total KB saved by cache represents the amount of of information (in response to a request - a "hit") which was NOT sent back to the user because the user already had a copy of that file from a previous request to your site.
- Total unique URLs is the number of unique URLs which were requested for your site. A URL is defined here as any path which leads to a file based on a request from a user. This means that something like "www.yoursite.com/home.htm" is one URL and "www.yoursite.com/imageonhomepage.gif" is another URL.
- Total unique sites represents the number of different ISP servers which provided the point-of-departure for a single user or a group of users (as with AOL) to browse your site. This really represents "server-to-server" communication where the server at the other end may represent a single user or thousands of users. The same user, incidentally, can come to your site through different servers as would be the case if they used an ISP at home and a different ISP at work. Each ISP would represent a unique site but the user would be only one individual.
- Total unique agents represents the number of different browsers which have viewed your site. There may be only two commonly used browsers (Explorer and Navigator/Communicator) but there are several versions of each running on several different kinds of machines. Each variation is a different agent.
- Total unique referrers is the number of other portals which were used as the "jump off" or departure point for a user to get to your site. This could represent a link returned as a positive response on a search engine. When the user clicks on that link, they are "referred" to your site. The number of unique referrers which users went through to get to your site can be complex because if your home page has links to lower-level pages on your website, each lower-level page clicked on by a user is "referred" by your home page. This number represents a "link" count more than it does users.
- Unknown responses are errors which weren't classified and if this number is small, less than one percent of the total hits, you can safely ignore it.
- Code 302 redirected requests are requests for a file on your site which might have moved and is thereby "redirected" or it might be a request for a file which doesn't exist but is instead a directory so the user's request is "redirected" to the equivalent of the "home.htm" page within that directory. This might be the case if you insufficiently identified an internal URL such as a link to a page from a picture you had added URL data to. In this case check to see that the URL is an actual file such as "home.htm" or "firstimage.gif".
- Code 401 unauthorized requests are attempts to get a file from an area where an authentication must occur between the browser and the server. This is true everytime you log into the Site Manager, for instance. An initial attempt to log into that area is not authenticated, the server sends an authentication request to the browser which displays it as your user logon screen and you log on. However, one authentication error has already occurred at that point.
- Code 403 forbidden requests are attempts to access an area on the server for which access is denied, even with authentication. These errors can also occur accidentally if users mistype a URL for the site they want to browse but the URL does represent a real area of the server, access to which was never intended.
- Code 404 not found requests are for errors where a link exists but the object the link refers to is not. This may mean a page you created has a page number you copied wrong or it may mean a link to a site which has moved and which you then need to correct. This could also occur accidentally if the user mistypes a URL, for instance uses "home.htm" when it is actual "home.html". This often occurs when trying to get a specific image file by typing the URL rather than clicking on a link, the image might be a "gif" as in "firstimage.gif" but the user typed "firstimage.jpg". Both of these URL represent possibly valid image files, but if the image is in one format with the correct extension and the user requests the correct file name but the other extension, an error will result. The confusion between "gif" and "jpg" and the equal confusion between "htm" and "html" as extensions lead to a large proportion of these kinds of errors. Consequently, make sure your extensions for your image files and anything else you reference as a URL or link is correct.
- Requests which required authentication represent the number of times you used either Site Manager or the Editor and made changes to your site. Each change requires authentication - which is good for you because only you have the password.
- Max hits per day is the number of requests for pages or images which your site received at the highest use period for the month you are viewing.
- Average hits per day is simply an average total number of hits in a month divided by the number of days and is a good number to use for planning purposes since it averages weekdays and weekends and all hours of each day.
- Max hits per hour represents the single hour this month where you received more hits than any single other time period.
- Average hits per hour represents the total number of hits for each hour in a 24-hour period and divides each hour's number of hits by the number of days. This can be a misleading number, though, since in the time period 1 am Eastern through 5 am Eastern (5am Greenwich to 9 am Greenwich) is the true lull period on the internet, at least for now. That period can have zero hits to your site, but the average hits per hour averages those times as well.
Hits by Day
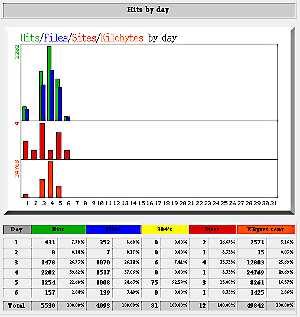
- These charts and tables are a breakout of the monthly statistics described above.
- In the Hits by Day section, each day is annotated along the bottom of the bar chart and the numbers of hits, files, 304s, sites and KB sent are indicated as color bars.
- Each day in the month is listed separately below in the table. The numbers in the table are shown on relative scales in the chart above. The chart scale is on the left side and is written vertically and represents the largest number for its color.
- These charts are a higher resolution view of the monthly charts shown above. The day-by-day charts will give you an idea of which days in the week and which weeks have been either better than average or worse than average.
- This level of detail is useful for determining trends and becomes useful in that regard only when you have several months' worth of data. Typically a site will have either a strong presence during the weekday or during the weekend, depending on the kind of service and/or product offered. This is useful for you if you are planning any special promotions or announcements. You will want to coincide those promotions or announcements to take advantage of a larger number of individuals browsing your site.
Average Load
Average Hits by Hour
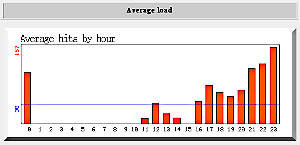
- This bar chart shows the distribution of website visitors throughout a 24-hour period. The entire month is averaged to produce this chart.
- This chart shows Eastern time (daylight or savings, depending) and will need to be adjusted for your time zone. 0 is midnight Eastern, 11pm Central, 10pm Mountain, 9pm Pacific, 8pm Alaska/Hawaii, and 5am the next morning in London and 6am the next morning in Paris.
- For general interest purposes the National Institutes of Standards and Technology Time Page is linked, as is a European-produced World Time Service. These links will take you to different servers so you will need to use your browser's Back button to return to the User Guide.
- The time of day which has the highest bar chart is the most active period for your website. Remember, though, that requests for your page can come from anywhere on Earth so the request may not necessarily be sent by the user at the time indicated. The time is the "server" time the request was received.
- Internet traffic patterns for the United States, including all time zones, generally begin to get strong at 7am Eastern and peak at between noon and 2pm Eastern and then trail slightly to another peak at between 6pm and 8pm Eastern and then decline gradually to a lull between 2am and 5am and then begin all over.
The 5 Top Seconds, Minutes and Hours
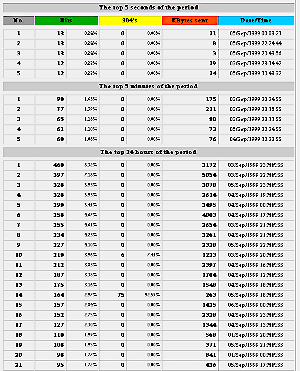
- The five busiest single seconds for your website for the month you are viewing is shown in the top section of this chart. The actual number of accesses is shown as an absolute number. To a large degree this represents the number of "concurrent" users of your website.
- Concurrent users are on at exactly the same time. However, since this measure of of "hits" it really represents the number of requests for file transfers. If one of your pages has several elements, all of which must be transferred to the browser in order for your viewer to see your page, a large number of "hits" will occur simultaneously. That would only be one person, though. You need to examine your home page and determine how many elements it has and then use that number to divide into hits to give you a good idea of individual users.
- More representative of different users is the top 5 minutes section. Over a one minute time period you have a better chance of seeing an average of user requests. If this number is substantially larger than the number of elements which comprise your home page (number of text blocks and different images), then you are probably seeing several individuals at your site during that time period.
- Of interest would be the specific time of day for the 5 top minutes. If all 5 of these are close to the same time of day, shown as a date followed by a time in this format: dd/mmm/yyyy hh:mm:ss, then that is the time when your site is at its most popular. The dates of those times would be important also if they were the same day of the week or a weekday versus a weenend day.
- The 24 top hour periods is interesting also in that once again you have a chance over a large number of days in a month to compare the time or whether the day itself is a weekday or weekend day. Since there are 24 representations of user visits, each slightly less busy than the one above it, this represents a good statistical snapshot. These statistics, observed and understood over a several-month period, can tell you a lot about the visitation characteristics of users who browse your site.
- This information may help you in designing or planning office hours or support hours or telephone or email routines. It may also point to a time of the day or a day of the week where extra effort on your part may be appropriate.
- It will also show the opposite. If a day is consistently not in the top ranks then that particular day of the week could be considered a lull period. That may be the time when you update your website or add new pages since you would be least likely to interfere with a potential visitor's ability to see your pages.
Top Ten Lists
The Top Ten lists give you a look at the most frequently accessed pages, the least frequently accessed pages, where your visitors are coming from and what browser they are using.
The 30 Most Frequently Accessed URLs
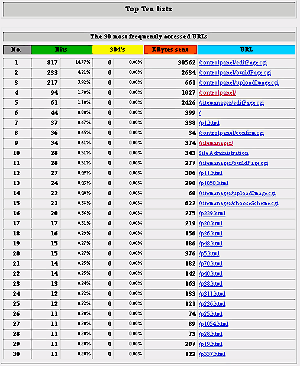
- This top 30 list shows you the frequency of access for the pages within you website.
- The first column, in gray, (No.) is the place ranking.
- The second column, in green (Hits), shows the number of page requests for this page.
- The third column, in yellow (304s), shows the number of requests for files which resulted in no file being transferred because the file already existed in the user's browser cache.
- The fourth column, in red (KBytes sent), shows the total amount of information transferred in kilobytes.
- The fifth column, in blue, (URL), is a hot link to the page being requested.
- You can click on the page link to see what it is that users are accessing.
- If you have been editing your website, the top-ranked URL may very likely be the Site Manager or Editor or a "uploadImage.cgi" or "buildPage.cgi" which indicates you are actively managing your site.
- These statistics are useful after you have finished creating or modifying your website because they will give you an indication of the variety of pages visitors are browsing on your site and the frequency of their requests.
- If, for example, you have several highly-ranked pages which are sub-pages on your site, you might consider moving those page closer to the top-level page or even making their contents available on your home page.
- Or, if you have several pages which receive high ratings but are lower-level pages, you might create links to these pages on your home page to further enhance visitors going there.
The 10 least frequently accessed URLs
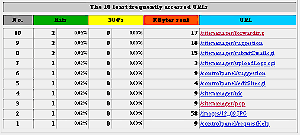
- Much like the most frequently visited pages, this chart shows the least visited pages on your website.
- These pages may be lower-level pages or they may be directly linked off your home page.
- The usefulness of these statistics is they show pages which are not getting visited very much by users browsing your site.
- If these pages contain information which you believe should be of interest to visitors, it's possible the links to these pages are not very visible or obvious to visitors. If that's the case, you can consider making the links more obvious or moving them to a different location on your home page.
- If you are considering cleaning your site and removing pages from this list, it might be useful to observe these statistics over several days or a couple of weeks. That way if a page suddenly picks up popularity, you can reconsider removing that page from your site.
- Keep in mind that a page's popularity has to do with its content and with the visibility of the link to that page. A page with content which may be of interest to a lot of visitors may get a small number of visits because the link is not obvious or in a very visible location.
- If you want a page to receive higher numbers of visitors, you can consider making several links to the page from different areas of your home page or from different sub-pages. You increase the likelihood of getting visitors to a sub-page if you make more links to that sub-page.
The top 30 sites most often accessing your server
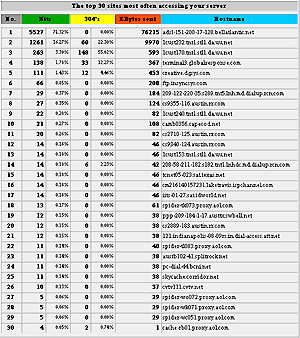
- This is a listing of the internet addresses from which requests have come to your website.
- Because most internet users are connected to an Internet Service Provide and dial in to get their internet connection, most of the Hostname addresses will be pretty meaningless.
- There are some clues buried in the Hostname column, though.
- Anything with "spider" in it is probably a search engine.
- Anything with "proxy" in it is probably a gateway for several dial-in customers to that Internet Service Provider's system.
- Anything with the words "dial-in" or "access" is definitely a dial-in connection.
- The benefit of this chart is that it can be compared over a series of days or weeks to see if there are any patterns associated with visitors to your website.
- One key feature of this chart is that it does show the top-ranked visitors by numbers of files transferred so you can see just how much time a visitor is spending on your site.
- The higher the "KBytes sent," the more pages of your site that visitor went to.
- Keep in mind that these statistics are averaged over a month and will change from day to day.
The Top Referers

- Top referers is the number of other portals which were used as the "jump off" or departure point for a user to get to your site.
- This could represent a link returned as a positive response on a search engine. When the user clicks on that link, they are "referred" to your site.
- The number of referrers which users went through to get to your site can be complex because if your home page has links to lower-level pages on your website, each lower-level page clicked on by a user is "referred" by your home page. This number represents a "link" count more than it does users.
- Consequently, these statistics can represent both the results of search engine queries which returned your site as a link and the number of internal links you have on your website.
- On the other hand, if the top-ranked Hostname has something like "Altavista" or "Yahoo" as part of the address, it probably is a search engine.
Most commonly used browsers
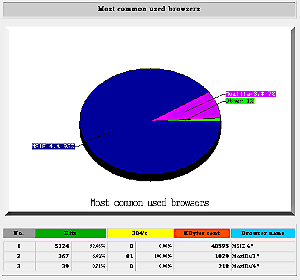
- This pie chart shows the percentage of users which are viewing your site using the different browsers available.
- Mozilla is the historic name for Netscape and represents anyone using a Netscape browser (Netscape, Navigator, or Communicator).
- MSIE is anyone using a Microsoft Internet Explorer browser.
- The chart will show the distribution among the browsers themselves and will further show versions of each browser if there are significant numbers of users with that version number.
- The numbers for Mozilla and MSIE represent users on both Macintosh and Windows machines. So, the Mozilla 4.x number represents all users on Macintosh and Windows computers with Netscape Navigator or Netscape Communicator browsers who have visited your website as a proportion of the total number of visitors.
- Other is any browser other than Netscape and Microsoft, including Apple Cyberdog, anyone using Lynx, or any other browser.
- The use of such a chart is generally for purposes of ensuring that the HTML code being written for the site is compatible with the number and kind of browsers viewing the site.
- There are specific HTML additions, not necessarily sanctioned, which both Microsoft and Netscape use. Sites which use these specific HTML tags are often difficult to view with browsers not compatible with the specific tags
- .website2Go. HTML code is written so it is completely compatible with browsers from Netscape and Microsoft.
- The graph below the pie chart contains the actual numbers from which the pie chart was created. As with all other charts, the Hits number represents requests for individual files including content and images.
Total transfers by Domain
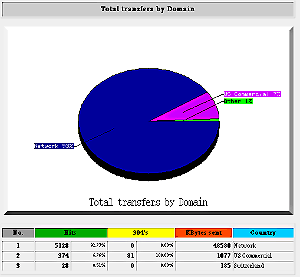
- This pie chart and graph show the distribution of visitors coming to your website from the various top-level domains of the internet.
- This chart is a visual representation of the chart discussed above showing "top 30 sites most often accessing your server."
- There are a number of top-level internet domains. Each represents a certain category of visitor:
| .com | Nearly all individual and commercial hosts use this domain. |
| .net | Originally this was intended for very large backbone system companies such as uu.net or att.net but now is use much like .com by individuals and companies. |
| .org | Originally this was intended for use by non-profit organizations. Like .net this is now used for companies and individuals. |
| .edu | This is used only by educational institutions and typically only very large universities or state university systems. It can be used by special educational institutions like the Space Telescope Institute. |
| .gov | Can only be used by an entity of the United States Federal Government. |
| .mil | Can only be used by an entity of the Department of Defense. |
- There is another domain which is also used by states and state school systems. It is .us. Many state high schools and elementary schools use the domain state.us, thus you would see school.state.us where state is the two-letter Post Office abbreviation (e.g. CA, AL, RI, NY, NC, MN, AZ, AK, etc.).
- What the distribution shows you is the number of individuals coming to your site from the variety of top-level domain hosts. If your site is of interest to teachers or universitites, for instance, a higher proportion of visitors from .edu or .us would be a good thing. If your site were of interest to officials or individuals working for the Federal government, a high .gov percentage would be good.
- Be cautious, though, because the internet top-level domains can represent companies, organizations, institutions, or individuals, these statistics cannot be used to indicate much more than the domains themselves indicate.
- The distinctions, as indicated, are .edu, .gov, and .mil. Because those top-level domain names are restricted, you can be sure that someone visiting with a .mil address is at a Dept. of Defense installation. Same for .edu and .gov.
You are here: Help Topics > Access Statistics